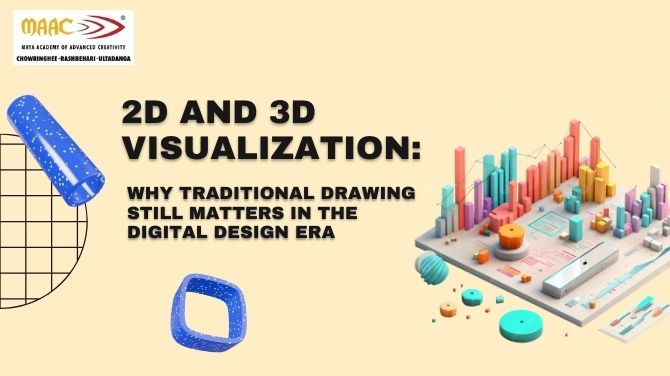
2D And 3D Visualization: Why Traditional Drawing Still Matters in the Digital Design Era
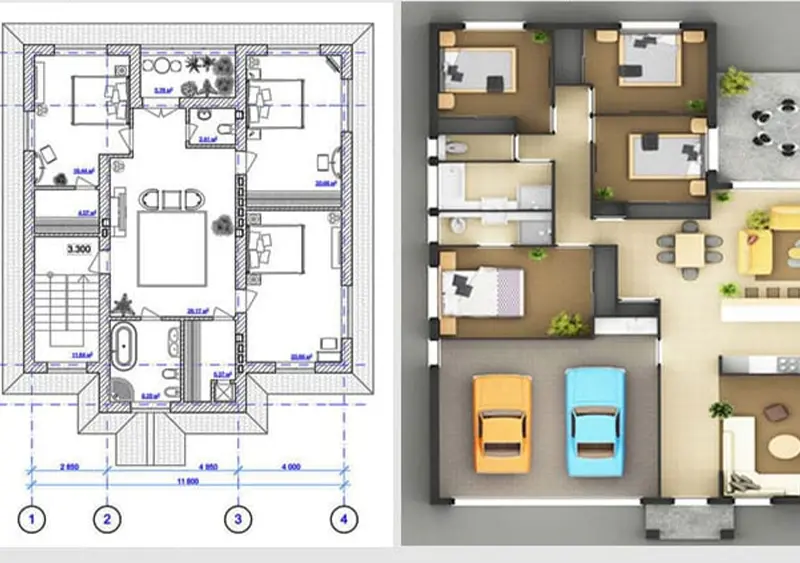
As design, fabrication, and manufacturing continue to evolve, 2D and 3D visualization have become vital tools across industries. In the building and construction sector, there is a rapid shift from traditional drafting methods to advanced 3D modelling workflows. While 3D models offer greater accuracy, efficiency, and realistic visualization—making designs easier to understand and reducing errors—2D drawings still hold strong relevance in the process.
Even as the future moves toward a more digital and 3D-driven workflow, 2D drawings, often shared in printed or digital formats, remain an essential part of industry practice. In today’s real-world scenario, both 2D and 3D methods work together, influencing construction and manufacturing by ensuring clear communication, proper documentation, and smooth project execution.
Two Widely Used Techniques Are 2D And 3D Visualization.
Each has its own strength and weakness but 3d visualization often stands out for its ability to offer a more immersive and detailed representation of data .
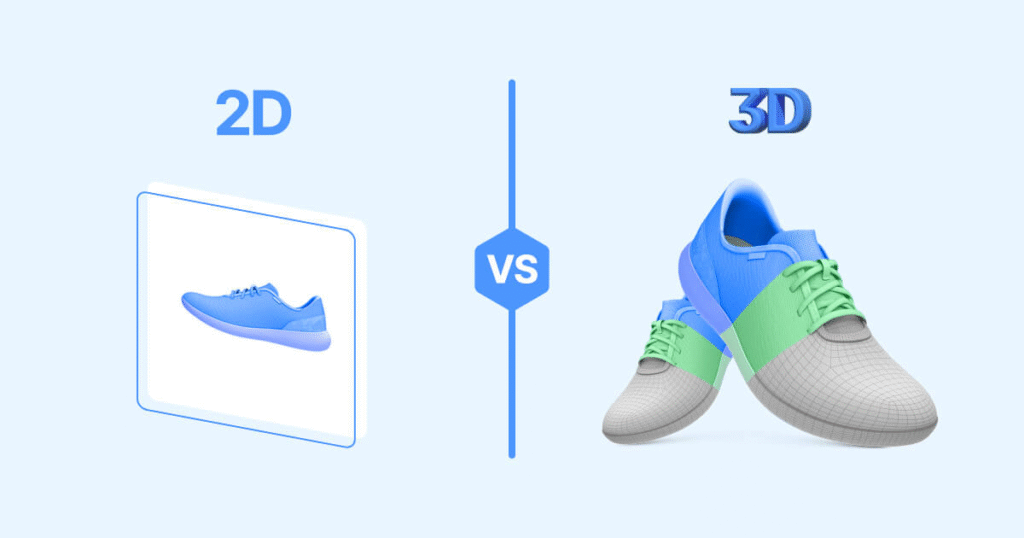
2d visualization is the traditional method of representing data employing flat two dimensional images such as chart graphs and maps.
Pros :
1. Simplicity –
The greatest strength of 2d visualization lies in its simplicity.
Tools like bar graphs, pie charts and line graphs are straightforward and may be interpreted by a broad audience.
2. Accessibility –
Because 2d visualization is familiar to most people they are very much universally available and they do not require specialized knowledge to be proficient in it.
This makes them effective for communication in various settings from board room presentation to educational classroom.
3. Performance –
2d visualization generally less computational power which means they might be rendered quickly and easily on most device
This efficiency is particularly beneficial while working with large data sets or in an environment where there is technology like the computer.
4. Cost effective –
Creating 2d visuals is typically less expensive and time consuming compared to 3d visuals.
Tools for generating 2d charts and graphs are often quickly available and user friendly thus reducing the need for specialized skill or expensive software.
Cons :
1. Limited Depth –
The primary drawback of 2d visualization is its inability to represent complex data sets with depth.
For data that involves various variables or intricate relationships, 2d visualization may over simplify and fall to capture the full picture.
2. Engagement –
This may be a remarkable disadvantage in fields where capturing the viewers attention is crucial, such as marketing, education or interactive presentation.
3. Context –
Without the ability to manipulate the view, 2d visuals often miss out on providing a comprehensive context specially for spatial or geospatial data.
Users are limited to fixed perspectives which might obscure important sights.
4. 3d Visualization –
3d visualization on the other hand employs three dimensional models to represent data , offering a more dynamic and immersive experience.
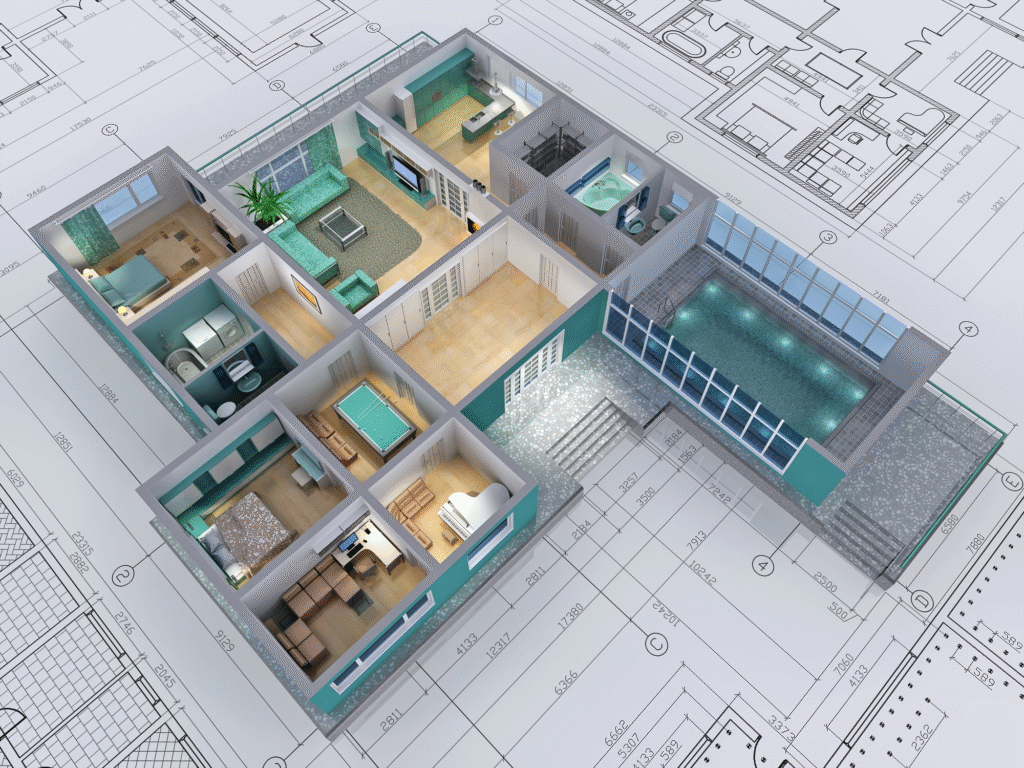
5. Depth And Detail –
3d visualization offers a richer representation of data showcasing depth and additional dimension that 2d visuals cannot.
This is particularly useful in fields like medicine engineering and environment science where understanding spatial relationships is critical.
6. Interactivity –
One of the standout features of 3d visualization is its interactivity.
Users may manipulate 3d models by rotating, zooming and exploring enhances their understanding and engagement with data .
This interactive capability is invaluable for training simulation and exploratory data analysis.
7. Realism –
3D visuals may provide a more realistic and immersive experience .
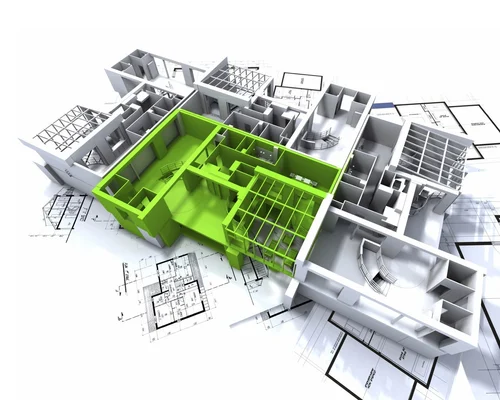
For instance architects and urban planners use a 3d model to create lifelike representation of buildings and cities enabling stakeholders to visualize projects before they are built.
8. Complex data representation –
3d visualization excels at representing complex data sets spatial information in scientific research for instance 3d models may illustrate intricate biological structure or geological formation in ways 2d representation.
2D and 3D Visualization: Choosing the Right Approach for Effective Communication
2D and 3D visualization play an important role in presenting information in a clear and effective way. 2D visualization is known for its simplicity and quick readability, making it ideal for charts, graphs, diagrams, and reports where information needs to be understood instantly without visual complexity.
On the other hand, 3D visualization adds depth and spatial detail, helping viewers understand complex forms and structures more realistically. It is widely used in fields such as architecture, engineering, healthcare, and mapping, where visual accuracy and perspective matter. As technology advances, 3D tools are becoming more user-friendly and cost-effective, leading to wider adoption. However, 2D visuals remain equally important, as simple and direct representations often communicate ideas more efficiently. Ultimately, choosing between 2D and 3D visualization depends on the purpose, audience, and nature of the data being presented.
Join MAAC Kolkata Today & Make An Awesome Career in 2D And 3D Industry.
Ph. No. – 8981005311 MAAC CHOWRINGHEE
Ph. No. – 8981006211 MAAC RASHBEHARI
Ph. No. – 8981009211 MAAC ULTADANGA


Comments
Post a Comment